Coherence Function

A statistical tool used in signal processing to analyze the correlation between two signals or datasets.
If the measurement time is representative of the entire system (ergodic process) and the system is linear, 
it can be used to estimate the causal relationship between the two signals.

Download

Calculation Steps

01

See Details
FFT
(Fast Fourier Transform)

Developed for real-time monitoring of Soviet nuclear tests.
Uses the Cooley–Tukey algorithm.
By reducing computational complexity, it is widely used in real-time signal processing and digital systems.

02

See Details
PSD
(Power Spectral Density)

Utilizes FFT.
Useful for analyzing the characteristics of signals containing noise.
Allows quantitative measurement of signal (energy) at each frequency.

03

See Details
CSD
(Cross Spectral Density)

Utilizes FFT.
Useful for analyzing the characteristics of signals containing noise.
Allows identification of common patterns in the frequency domain between two signals.

04

See Details
Coherence Function

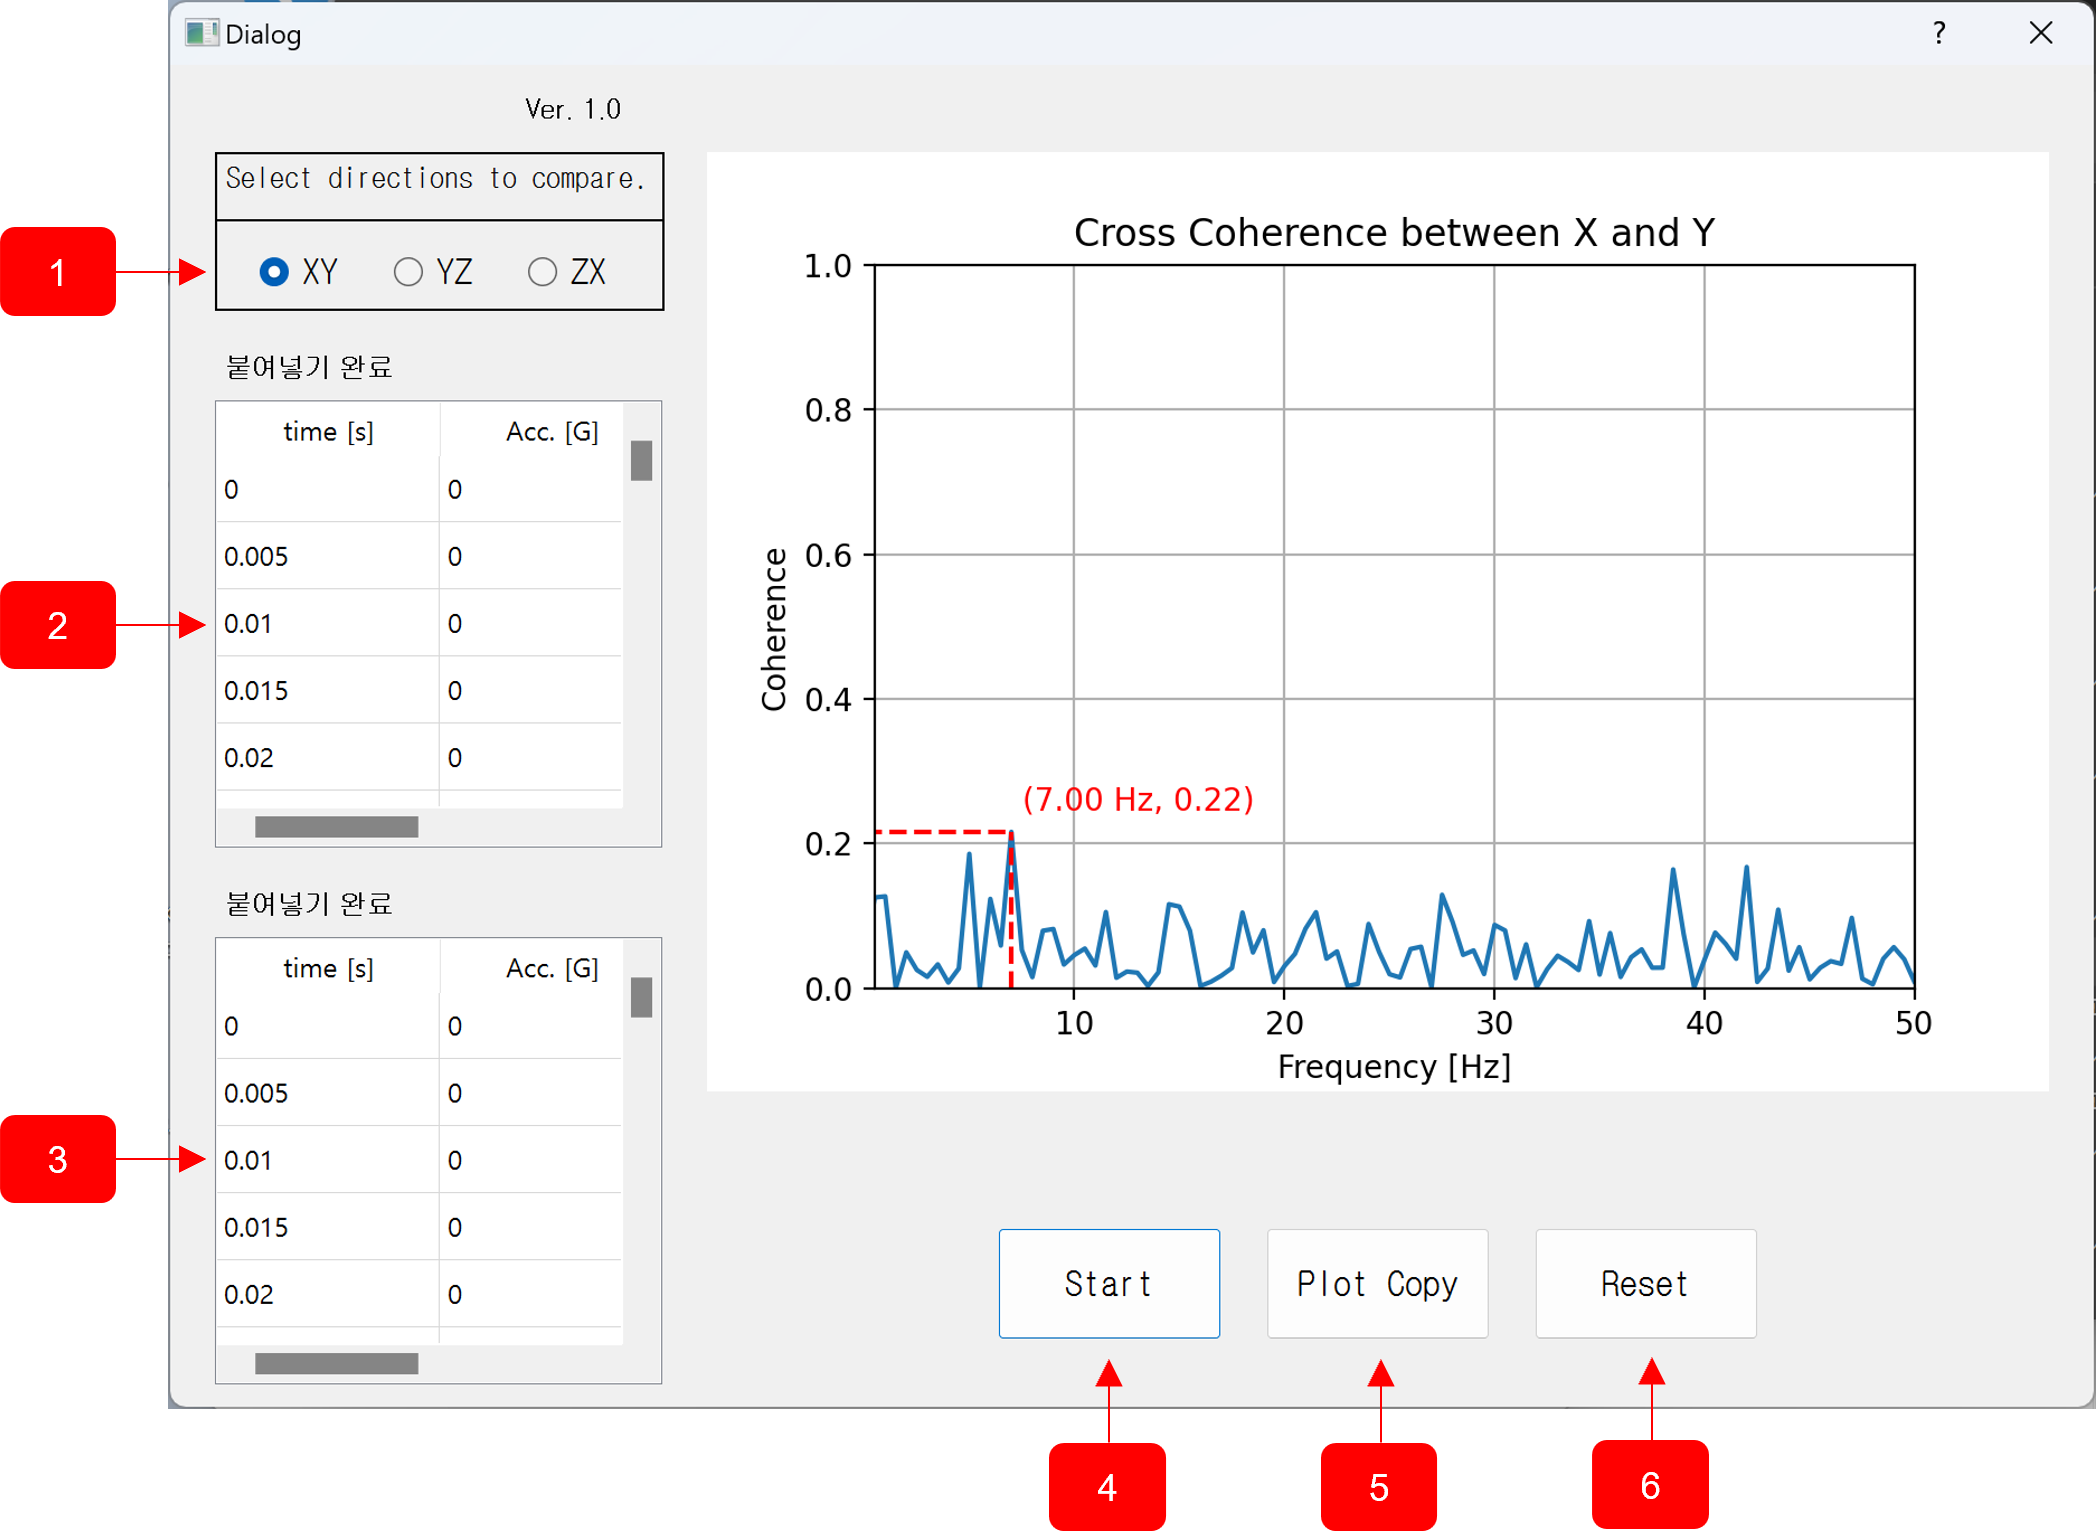
a statistical measure used in signal processing to analyze the relationship between two signals or data sets.
 It provides a value between 0 and 1 for each frequency (higher value indicating stronger relation), and can be used to estimate causality in linear, ergodic systems.

How to use it?

1. Select the seismic loads you wish to compare. (Your selection will be reflected and displayed in the graph title, XY is currently selected by default.)

2. Copy the X-direction time history RRS from Excel and paste it.

3. Copy the Y-direction time history RRS from Excel and paste it.

4. Click the "Run" button. The Coherence function will be calculated and displayed in the graph window along with its maximum value.

5. Click the "Copy Graph" button. This copies the image to the clipboard. (Use this function to paste the graph image into reports or presentations like PPT.)

6. Click the "Reset" button to return the program to its initial state

Go to Top Page